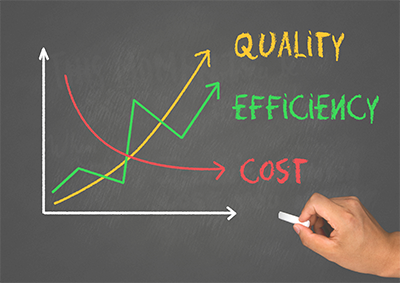
Q-Monitor visualizes Product Data Quality (PDQ) throughout the entire process chain, providing clear insights into both the current status and historical data quality trends. It enables real-time tracking of data accuracy, highlights areas for improvement, and helps ensure consistency across all stages of development. By offering detailed visibility, Q-Monitor supports better decision-making, reduces errors, and enhances overall product quality management.
Benefits

Identifying Frequent Errors
Identifying common errors and enabling prevention through targeted designer training improves design quality, reduces costly mistakes, enhances collaboration, and boosts efficiency in future projects.

Evaluation
Evaluating departments, projects, or suppliers to set requirements for targeted quality actions improves alignment, drives continuous improvements, ensures compliance, and enhances overall performance.
Measurement
Measuring PDQ improvements over time for ROI analysis of Q-Checker highlights saved rework time, justifies investments, demonstrates efficiency gains, and supports data-driven decision-making.

A Few Mouse Clicks
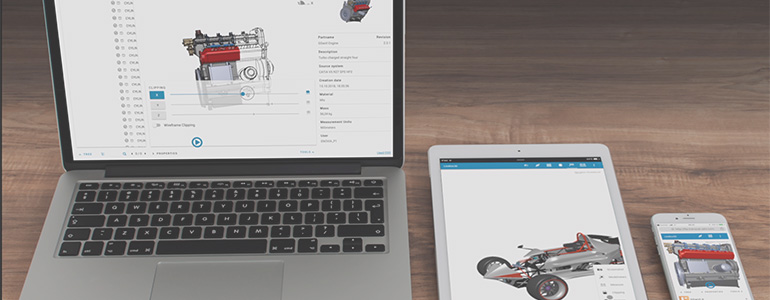
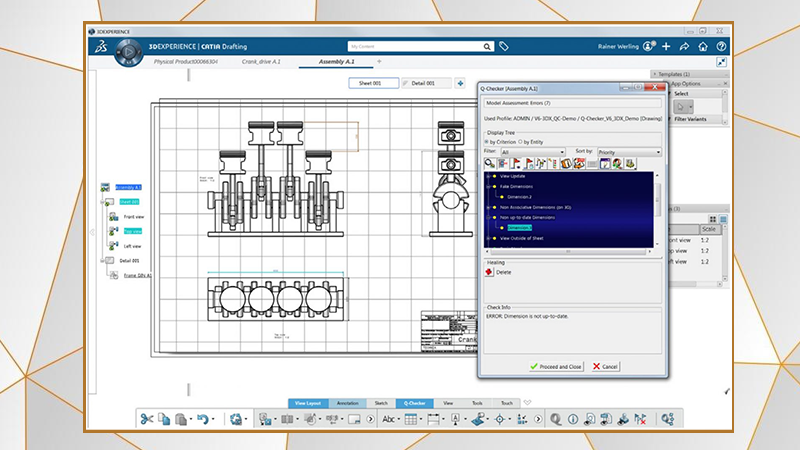
CATIA verifications save results to Q-Monitor, quickly generating detailed graphical cross-section views, improving analysis, accelerating issue identification, and streamlining the review process.


Latest Blog Posts
Discover our most recent posts across all industries, brands and topics
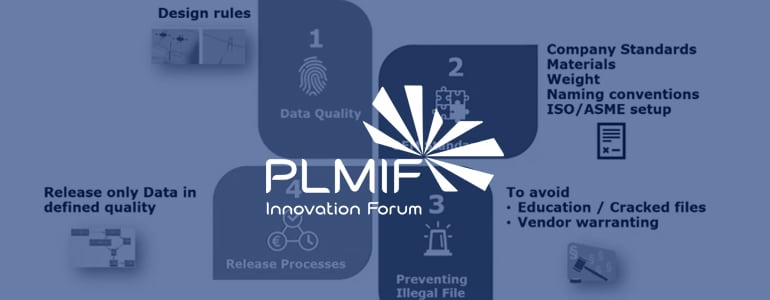
Derive Customer Delight with Optimized Quality Control of your Product Data to meet your Organization Standards
Quality Control (QC) is a vital process in product development that guarantees defect-free products to customers. Ideally, product design and development is done with the…